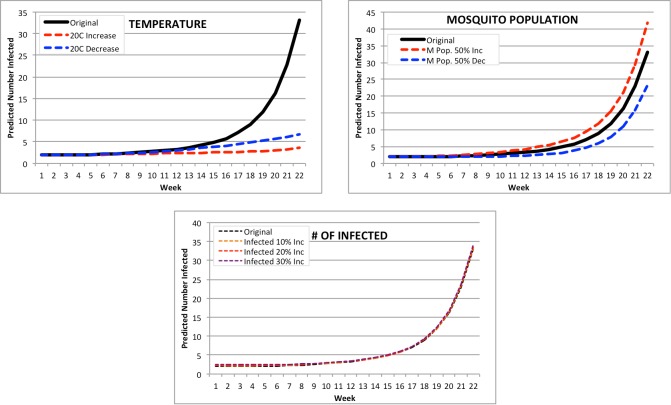
Figure 6.
Modified Forecasts for Saba. Top left: Forecasts for original Feb. 2015, or with a + or -20C input modification. Top right: Forecasts for original Feb. 2015, or with a + or -50% mosquito population. Bottom: Forecasts for original Feb. 2015, or with a ⩲ 10%, 20%, or 30% population increase.

