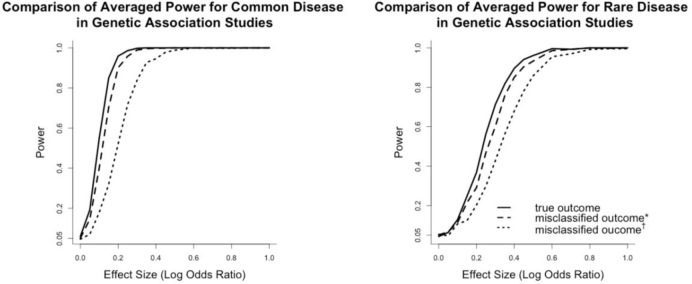
Figure 4.
Comparison of averaged power for common and rare diseases. The averaged powers were obtained by sampling without replacement from the MAF distribution of CEU population. Misclassified outcome* stands for high sensitivity and specificity (Sensitivity=0.84, specificity=0.96 for common diseases; sensitivity=0.857, specificity=0.997 for rare diseases). Misclassified outcome† stands for low sensitivity and specificity (Sensitivity=0.665, specificity=0.819 for common diseases; sensitivity=0.707, specificity=0.988 for rare diseases).

