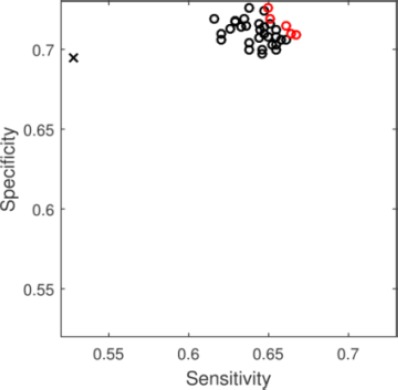
Figure 3:

Sensitivity and Specificity for predictive models. Circles show models produced by the decision support pipeline that makes decisive decisions in more than 60% of the individual. Red open circles shows the Pareto front. Black x shows the predictive performance of ASD.
