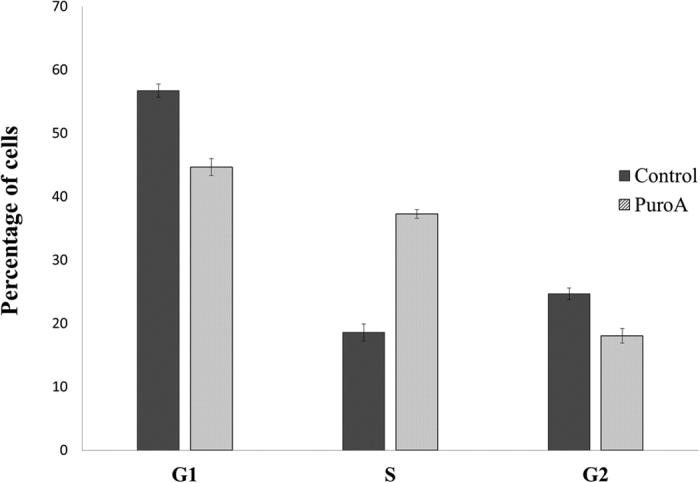
Figure 3. The effects of PuroA on the cell cycle progression of C. albicans cells.

The cells were treated with PBS or 125 μg\mL of PuroA and their DNA contents was labelled with PI and analysed by flow cytometer. Histogram indicates the percentage of C. albicans cells in each phase of the cell cycle. Data are presented as mean values ± standard deviations of two independent experiments.
