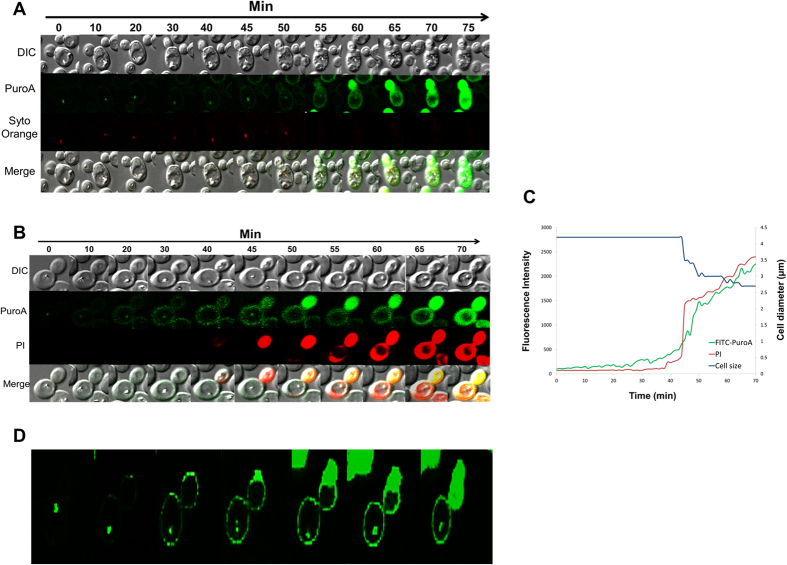
Figure 4. Sequence of events during attack of a single C. albicans cell by FITC-PuroA at 8 μg\mL, time-lapse confocal microscopy images taken in real time.
(A) Cell nucleus stained with SYTO 85 Orange before addition of FITC-PuroA; the snapshots were taken from a single movie at the times shown at top. (B) PI was added simultaneously with the peptide, the snapshots were taken from a single movie at the times shown at top, right scale shows total intensity of green and red fluorescence associated with the cell vs. time over 70 min. (C) For the same cell in b, plots of total FITC intensity (green line), total PI intensity (red line) and cell size (blue line) vs time, only one single cell was amenable to quantitative analysis. (D) Single colour experiments using only FITC-PuroA.

