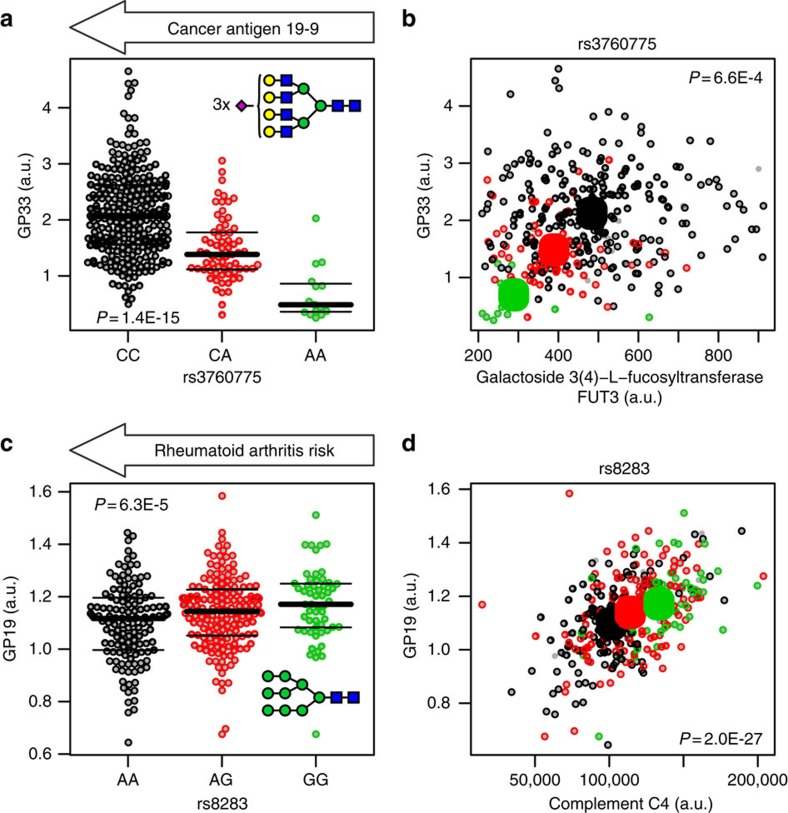
Figure 3. Genotype-dependent co-associations of the plasma proteome and the plasma N-glycome.
Bee swarm plots of total plasma N-glycans GP19 and GP33 (% of total N-glycan content) as a function of rs3760775 and rs8283 genotype, respectively, see inset for glycan structure, Blue squares: N-acetylglucosamine, green circles: mannose, yellow circles: galactose, purple diamonds: N-acetylneuraminic acid; Scatter plots of total plasma N-glycans GP19 and GP33 as a function of Complement factor 4 (C4) and Galactoside 3(4)-L-fucosyltransferase (FUT3) genotype (raw data), respectively (b,d), black: major allele homozygotes, red: heterozygotes, green: minor allele homozygotes. Large circles indicate means by genotype. P values are for the association of glycans with genotype (a,c) and of glycans with protein levels (b,d). P values are uncorrected from linear regression. The major allele variant of SNP rs3760775 was reported to be associated with the cancer antigen 19-9 and that of SNP rs8283 with increased risk of rheumatoid arthritis.

