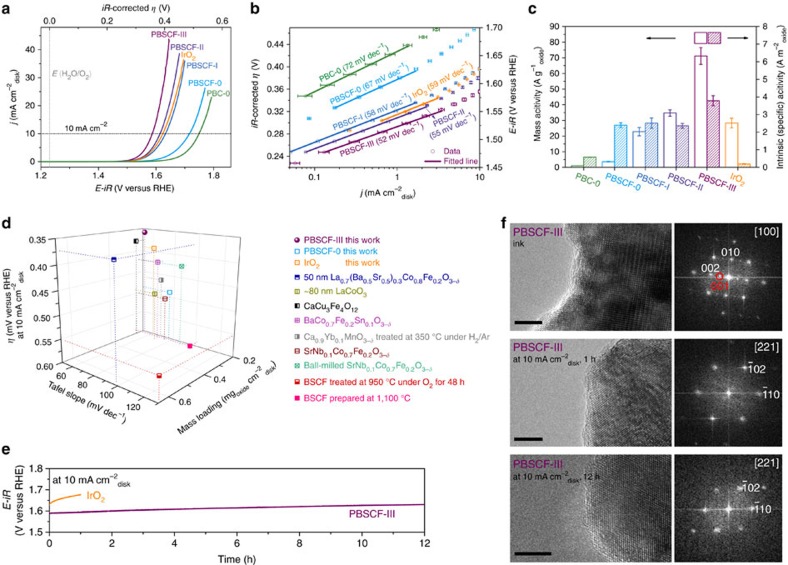
Figure 2. Electrochemical properties and structural stability of catalysts.
(a) Capacitance- and ohmic resistance-corrected OER activity curves of IrO2, PrBaCo2O5+δ (PBC), PrBa0.5Sr0.5Co1.5Fe0.5O5+δ (PBSCF) powders and PBSCF nanofibers in 0.1 M KOH at 10 mV s−1 with a rotation rate of 1,600 r.p.m. These curves were averaged from three independent measurements. (b) Tafel plots obtained from the steady-state measurements. (c) Mass activities and BET surface area-normalized intrinsic activities of catalysts at η=0.37 V derived from (a); error bars represent s.d. from three independent measurements. (d) OER activity comparison in 0.1 M KOH. iR-corrected overpotential (η) at 10 mA cm−2disk, Tafel slope and catalyst mass loading of PBSCF-0, III and IrO2 in this work are compared with recently reported advanced perovskite catalysts with novel compositions11,12,13,14, nanostructures11,15 and atmosphere-treated surfaces17,18; all η derived from literatures are iR-corrected, mass loading of Ca0.9Yb0.1MnO3−δ is missing17 and is assumed to be the same to the lowest number in the figure; BSCF is Ba0.5Sr0.5Co0.8Fe0.2O3−δ; iR-correction is very important for reliable comparison of results from different test devices (Supplementary Fig. 13; Supplementary Table 3; Supplementary Note 6). (e) Chronopotentiometric curves of the PBSCF-III nanofiber and commercial IrO2 catalysts at 10 mA cm−2disk. (f) High-resolution TEM images and the corresponding FFT patterns of the PBSCF-III after ink preparation process (ultrasonic treatment for 5 h), and chronopotentiometry test at 10 mA cm−2disk for 1 h and 12 h. Scale bar, 5 nm.

