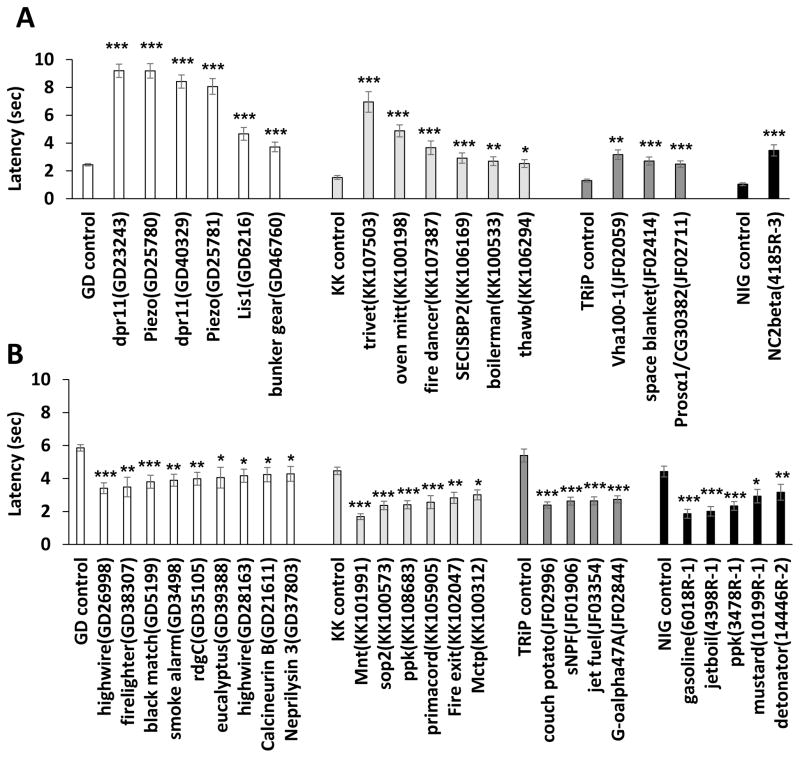
Figure 2. RNAi lines that showed significant insensitivity or hypersensitivity upon retesting with a larger sample size.
The behavioral responses of retested lines in the hypersensitivity and insensitivity screens. Each panel shows average latency on the Y axis and the targeted genes for each genotype are listed along the X axis. (A) ppk-GAL4 dependent insensitive behavioral responses seen with crossing to 1st-generation VDRC (GD) lines, 2nd-generation VDRC (KK) lines, TRiP lines and NIG lines. (B) ppk-GAL4 dependent hypersensitive behavioral responses seen with crossing to VDRC (GD and KK) lines, TRiP lines and NIG lines. Steel’s test was used to statistically compare each genotype to its appropriate control except that Mann-Whitney’s U-test was used to perform the pair-wise comparison of NC2beta versus NIG control (n > 32; * p < 0.05, ** p < 0.01 and *** p < 0.001). Error bars represent S.E.M. See also Table S1F-O, Table S2 and Figure S1.

