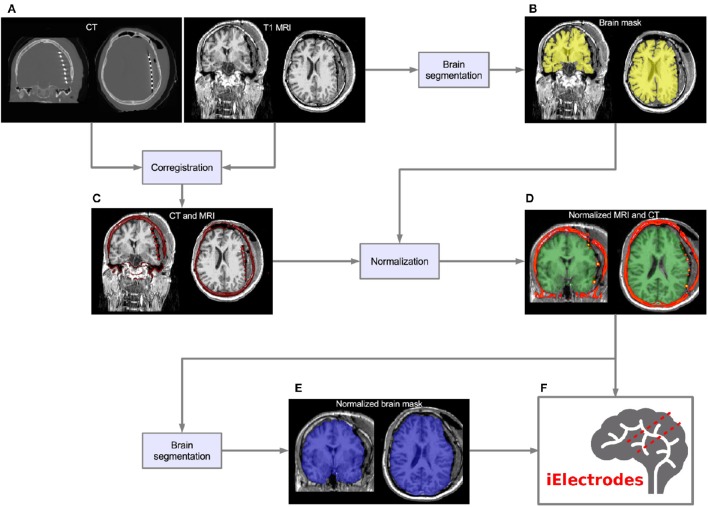
Figure 1.
Pre-processing pipeline. (A) Acquired images, CT and T1 MRI, showing electrode artifacts, brain shift and compression caused by edema. (B) A brain mask (yellow) is obtained by segmenting the MRI. Notice that the mask border follows the brain surface accurately. (C) MRI and CT images are coregistered in native space. Observe the electrode artifacts in the thresholded CT (red) over the MRI. (D) Using the previous brain mask (yellow), the MRI is spatially normalized and the same transformation applied to the CT. Observe the CT (red) on top of the normalized brain MRI. For illustrative purposes we also show the MNI average brain mask (green). (E) A normalized brain mask is obtained (blue) from the normalized MRI. (F) Normalized MRI, CT, and brain mask images are loaded into the iElectrodes toolbox. Example images correspond to patient 2, implanted with an 8 × 8 grid over the left frontal, temporal, and parietal lobes.

