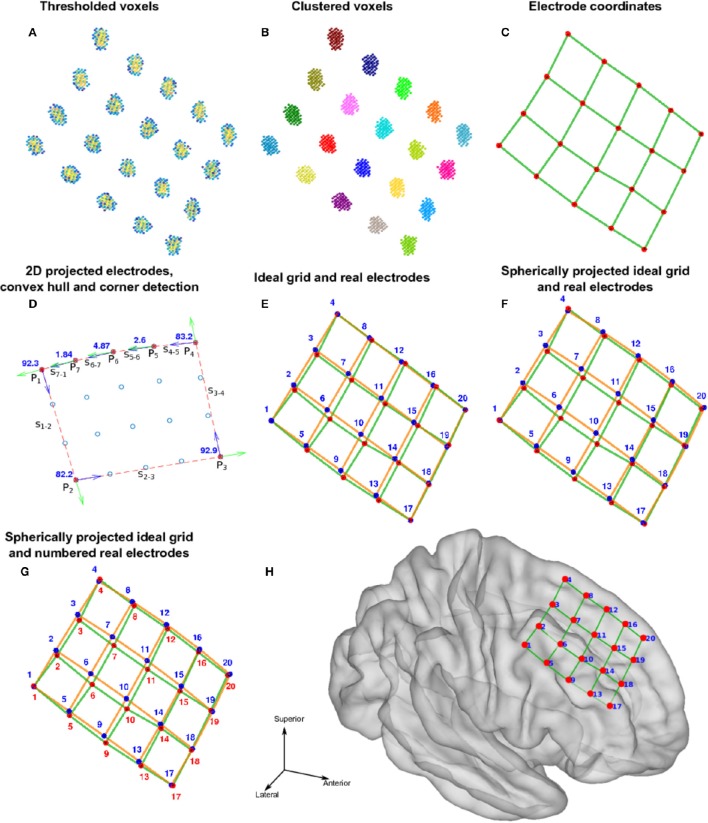
Figure 3.
Localization and numbering of electrodes. (A) Thresholded CT voxels corresponding to a 4 × 5 grid (color coded HU) from patient 6. (B) Clustered voxels (each color denotes a different cluster). (C) Detected electrodes locations (red dots), i.e., center of mass of each cluster. (D) Electrode coordinates projected in 2D principal components space (blue circles). Convex hull described by a subset of points P (red asterisks) and segments S (red lines) connecting this points. Arrows show previous (green) and next (blue) segment direction at each point. The transition angle (in degrees) at each point is shown (blue). Points 1, 2, 3, and 4 correspond to the four biggest angles and also the corners of the grid. (E) Ideal planar grid (blue dots) and real grid electrode locations. Ideal grid electrodes are numbered (blue). (F) Radial projection of ideal electrode grids. (G) Real grid electrodes are numbered (red) according to closest ideal grid electrodes. (H) MNI semitransparent brain with localized and numbered electrodes.

