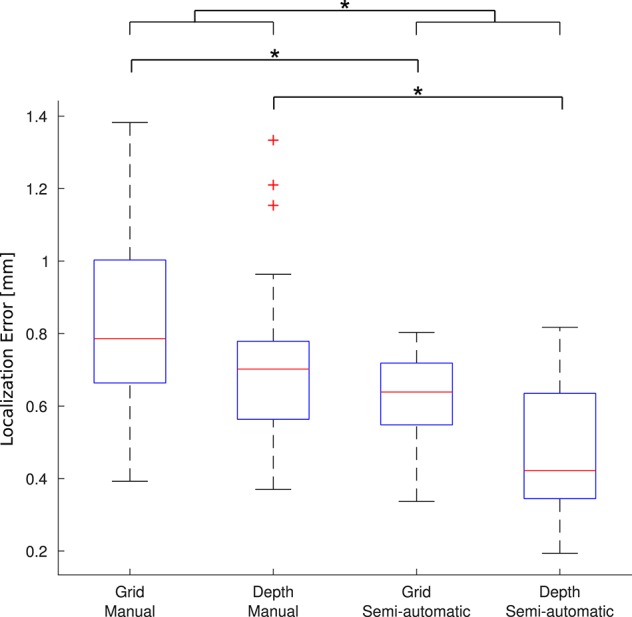
Figure 8.

Localization error. Each boxplot shows the error (distance to the gold standard) for manual localization and for using iElectrodes to semiautomatically localize grids and depth electrodes. The center lines of each boxplot represents the median and the edges are the 25th (Q1) and 75th (Q3) percentiles. Whiskers are located at Q1 −1.5(Q3 −Q1) and Q3 +1.5(Q3 −Q1), and outliers are plotted outside this interval. *Denotes p < 1 × 10⁻⁵.
