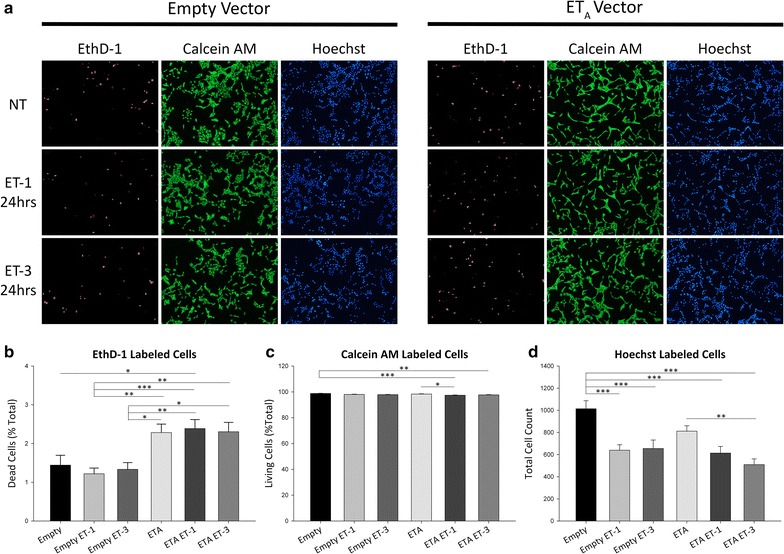
Fig. 3.

Live-Dead assay of 661W cells stably overexpressing the ETA receptor. a Representative images of EthD-1 (red fluorescence), calcein AM (green fluorescence) and Hoechst (blue fluorescence) labeled 661W stable clones indicating dead, living and total cells respectively. Images were taken following 24 h treatment with either 100 nM ET-1 or ET-3. b–d Quantitative analysis of b EthD-1+, c calcein AM+ and d Hoechst labeled cells. Bars represent mean ± SEM (n = 3). Asterisks indicated statistical significance *p < 0.05; **p < 0.01; ***p<0.001 by one-way ANOVA and Tukey’s post hoc test
