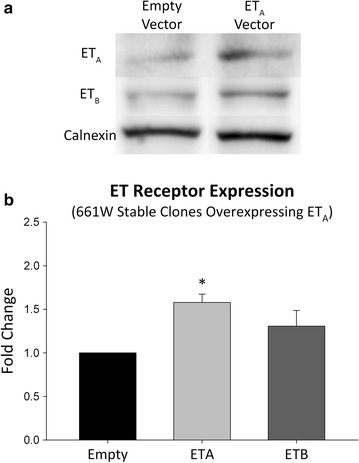
Fig. 6.

Overexpression of the ETA receptor can increase in ETB receptor expression. a Representative images. Immunoblot showing the expression of ETA and ETB receptors in the plasma membrane fraction of 661W stable clones overexpressing the ETA receptor. b Immunoblot densitometry showing fold change in protein expression of both ETA and ETB receptors in 661W cells overexpressing the ETA receptor compared to empty vector cells. Protein normalized to calnexin expression. Bars represent mean ± SEM (n = 5). Asterisks indicated statistical significance *p < 0.05 by student’s t-test
