
Fig. 1.
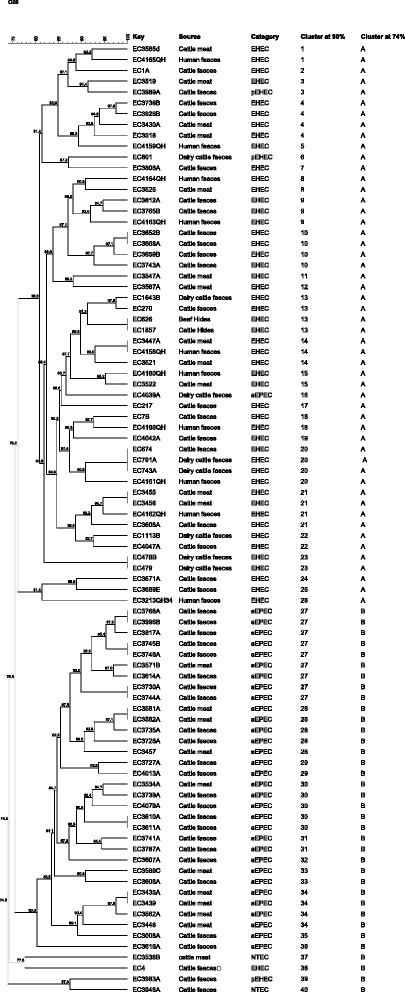
PFGE profiles and clusters of O26 isolates investigated in this study. All 88 isolates were analysed by PFGE with XbaI, and cluster analysis of the patterns was performed by BioNumerics V7.5 software using the Dice coefficient and unweighted pair group method (UPGMA). The degree of similarity (%) is shown on the scale at the top left of the figure. The cut-off level of 90% was chosen to assign isolates to the same cluster. At 74% similarity isolates were assigned to 2 clusters (a & b)