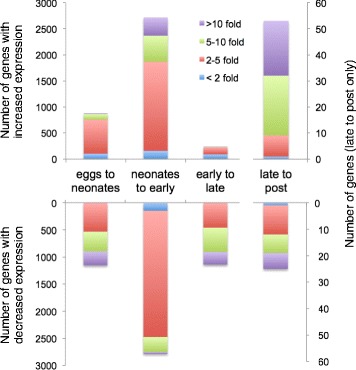
Fig. 3.

Differential expression at life stage transitions in Brachionus manjavacas. Bars indicate the number of significantly differentially expressed genes is indicated for each transition, with color indicating fold-change (3-fold change = 23 difference in transcript abundance). Note that the late- to post-reproductive transition uses the right y-axis
