
Fig. 2.
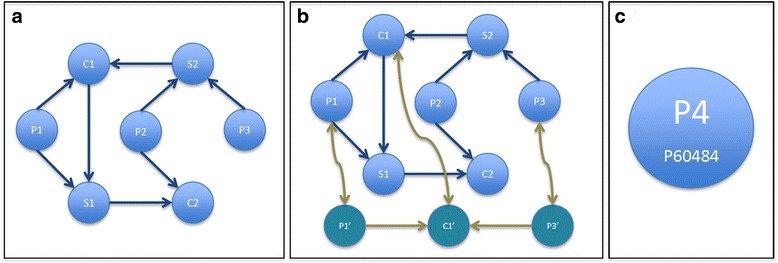
Graph representation where P are proteins; C are complexes, S are sets and prime nodes are the same but for other species. a One species graph. b Relation between two species. c Base node content
Official websites use .gov
A
.gov website belongs to an official
government organization in the United States.
Secure .gov websites use HTTPS
A lock (
) or https:// means you've safely
connected to the .gov website. Share sensitive
information only on official, secure websites.
Graph representation where P are proteins; C are complexes, S are sets and prime nodes are the same but for other species. a One species graph. b Relation between two species. c Base node content