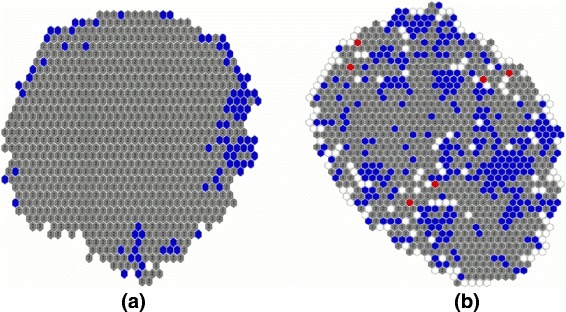
Fig. 6.

GSOM maps for DDI data: (a) shows the GSOM map for Similarity Feature Representation 1 (SFR1) when Spread Factor=0.1 and it contains 919 nodes; (b) shows the GSOM map for Similarity Feature Representation 2 (SFR2) when Spread Factor= 10−15 and it contains 922 nodes. The nodes shown in blue are the proposed negative nodes having only unlabeled instances, the nodes shown in grey contains both initial positives and unlabeled instances, and the nodes shown in red contains only initial positives
