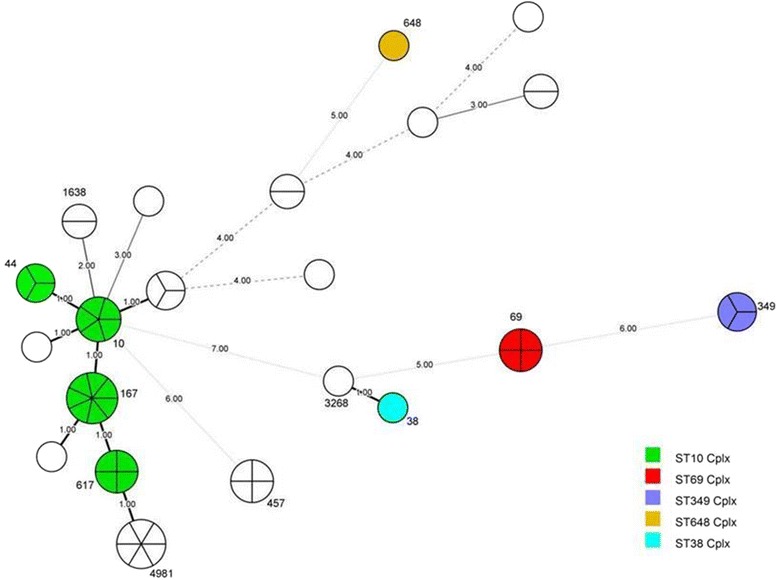
Fig. 2.

Minimal spanning tree (MSTree) of ESBL-producing E. coli. Each circle indicates one ST, subdivided into one sector for each isolate, and bordered by the ST number. White circles or sectors without an ST number denote a lack of comparison standard in the current databank. The numbers on the connecting line between STs within the MSTree indicate the number of different alleles. Solid lines represent an allele difference of 3 or less, whereas dotted lines and faint lines indicate an allele difference of 4 or more
