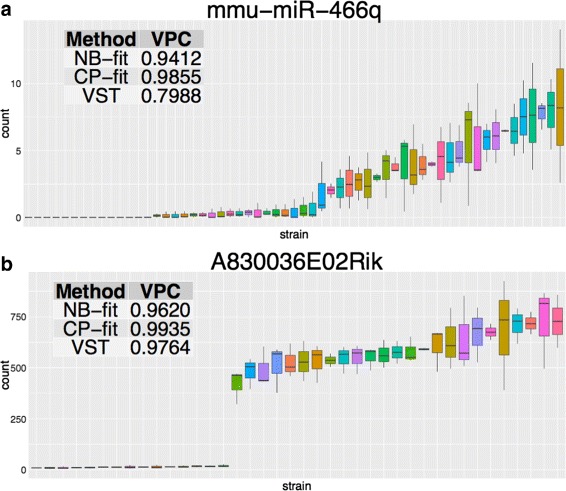
Fig. 6.

Sequencing read examples for a a top heritable miRNA and b a top heritable mRNA features. Each boxplot summarizes the reads for one strain and they are sorted by strain mean in an increasing order. The color of the boxes have no special significance. The estimated VPC scores are reported in the top left tables
