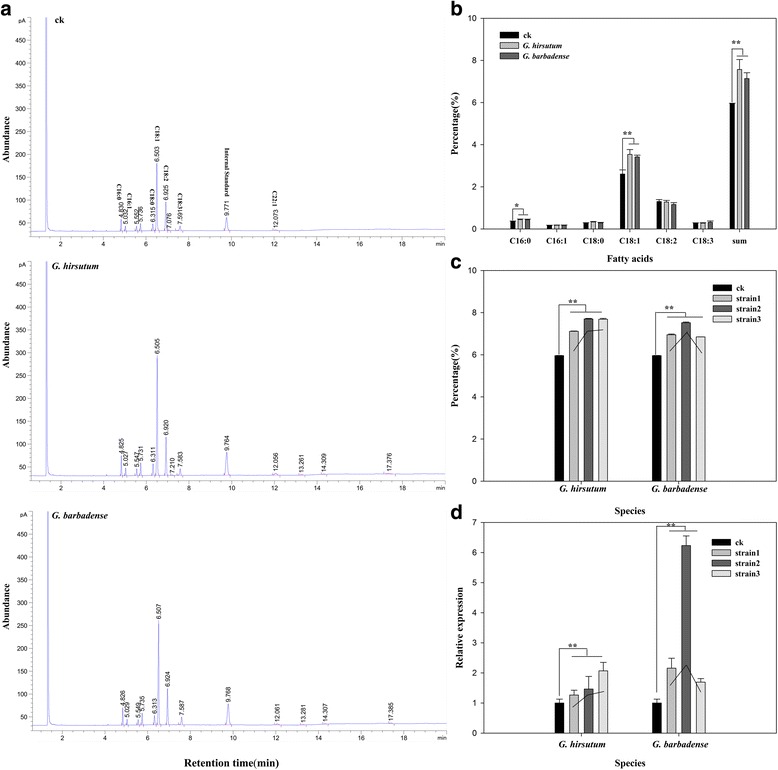
Fig. 6.

Content of TAG and fatty acids in At-Gh13LPAAT5 transgenic yeast strains. a Gas chromatography/mass spectrometry chromatogram of fatty acids from transgenic yeasts. b The content of fatty acids in transgenic yeasts. c The total TAG content in three transgenic yeast strains from two backgrounds G. hirsutum and G. barbadense, respectively. d Expression patterns of At-Gh13LPAAT5 in three transgenic yeast strains. ** and * indicate correlation at the 0.01 and 0.05 significant levels, respectively
