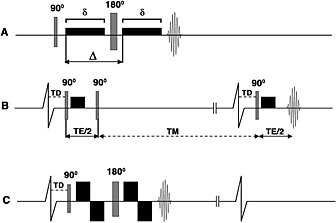
Figure 3.

Pulse sequences used for diffusion imaging of the myocardium. (A) PGSE or Stejskal–Tanner sequence; (B) dual‐gated STE sequence; (C) velocity‐compensated PGSE sequence. The diffusion‐encoding gradients are represented by the black rectangles (rise time is ignored), δ is the duration of the diffusion‐encoding gradient and ∆ represents the time between diffusion gradients. Single‐shot EPI readouts are used in all cases. (A) PGSE sequence with diffusion‐encoding gradients on either side of the 180° refocusing pulse. The sequence is highly sensitive to motion and has a relatively long T E. (B) Diffusion‐encoded STE sequence. The diffusion time is equal to T E/2 plus the mixing time (T M) and is equal to the RR interval. (The vertical lines breaking the baseline of the ECG indicate that the timeline is not drawn to scale.) (C) Velocity‐compensated PGSE sequence with bipolar diffusion‐encoding gradients on either side of the 180° refocusing pulse. Implementation of this sequence in vivo is feasible with ultra‐high gradient strengths, which allow δ and T E to be kept acceptably short. Reproduced with permission 13.
