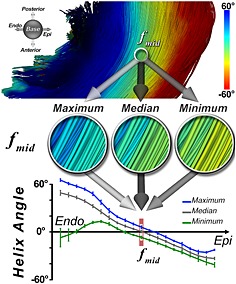
Figure 10.

Quantification of tract coherence in the myocardium. The TCI is based on the maximum, median, and minimum HA classifications of myofibers within an ROI. The maximum, median, and minimum HA curves are derived by averaging each HA classification successively in the base–apex and anterior–posterior directions of the ROI at each voxel. This creates the three transmural HA curves. In the midmyocardium and subepicardium, tract coherence is high and the curves lie close to each other. In the subendocardium, however, tract coherence is reduced due to the effect of the papillary muscles and endocardial trabeculations. Reproduced with permission 21.
