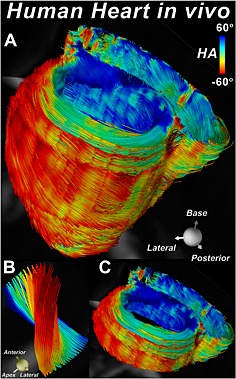
Figure 16.

Tractography of the whole heart of a normal volunteer without slice gaps 79. The fibers are color coded by their HA. Twelve contiguous short‐axis slices, each 8 mm thick, were imaged with the STE approach. (A) The entire heart viewed from the postero‐lateral perspective. (B) Tracts intersecting a small ROI placed in the lateral wall at the mid‐ventricular level. The evolution of HA from positive in the subendocardium to negative in the subepicardium is clearly seen. (C) Tractography within a basal short‐axis slab depicting the transmural arrangement of myofibers in both the left and right ventricles. Original images provided by the authors.
