
Fig. 2.
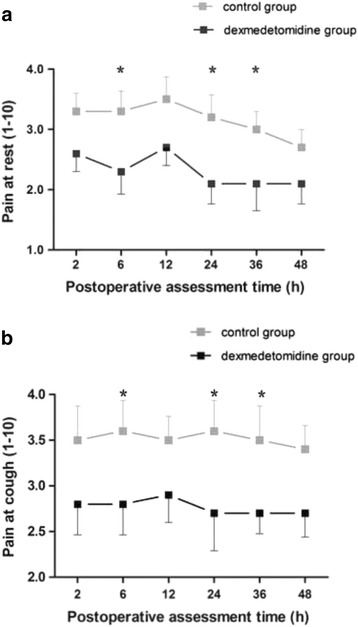
Postoperative visual analogue scale (VAS) pain scores. Evaluation of pain score on VASR (a) and VASC (b) (Values represent means with 95% confidence interval) in the two groups. P < 0.001 by General Linear Model analysis, subsequent comparison between the groups: asterisk = P < 0.023 in VASR and P < 0.02 in VASC after the post hoc analyses, dexmedetomidine group vs. control group