Figure 6.
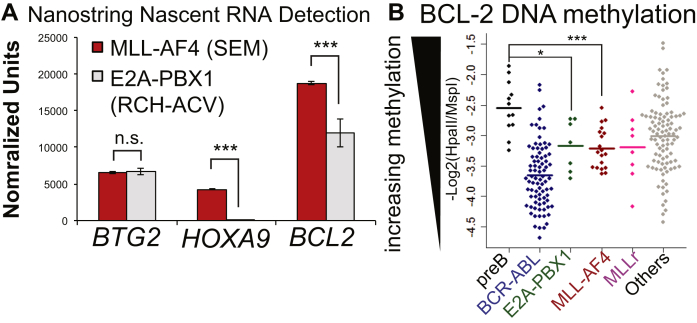
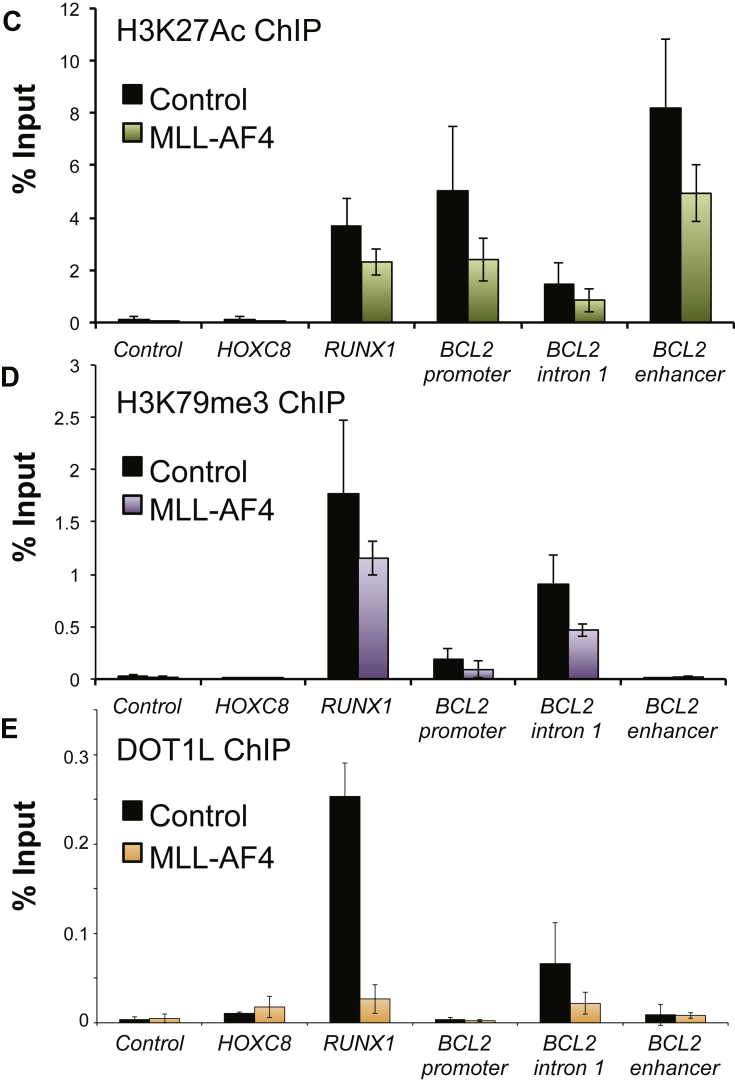
MLL-AF4 controls both H3K27Ac and H3K79me3. (A) Nascent RNA purified from SEM (MLL-AF4, red bars) and RCH-ACV (E2A-PBX1, gray bars) and quantified on a NanoString probe array. Average of two replicates. BTG2 is a gene target transcribed at equal levels in both samples and is presented as a sample control. HOXA9 (a canonical MLL-AF4 target gene) and BCL-2 both display reduced transcription in the E2A-PBX1 sample. ***p < 0.001, NanoStriDE sequencing normalized. (B) BCL2 methylation data from the ECOG E2993 ALL trial (n = 215) revealing reduced DNA methylation at BCL-2 in E2A-PBX1 (green) and MLL-AF4 (red) patients. Each point represents one patient or normal sample; the bar is the average value. ***p < 0.001, *p < 0.05. (C–E) ChIP in MLL-AF4 siRNA treated SEM cells (colored) compared with control (black) using antibodies to H3K27Ac, H3K79me3, or DOT1L. Bars represent the averages of three independent experiments; error bars are SD.


