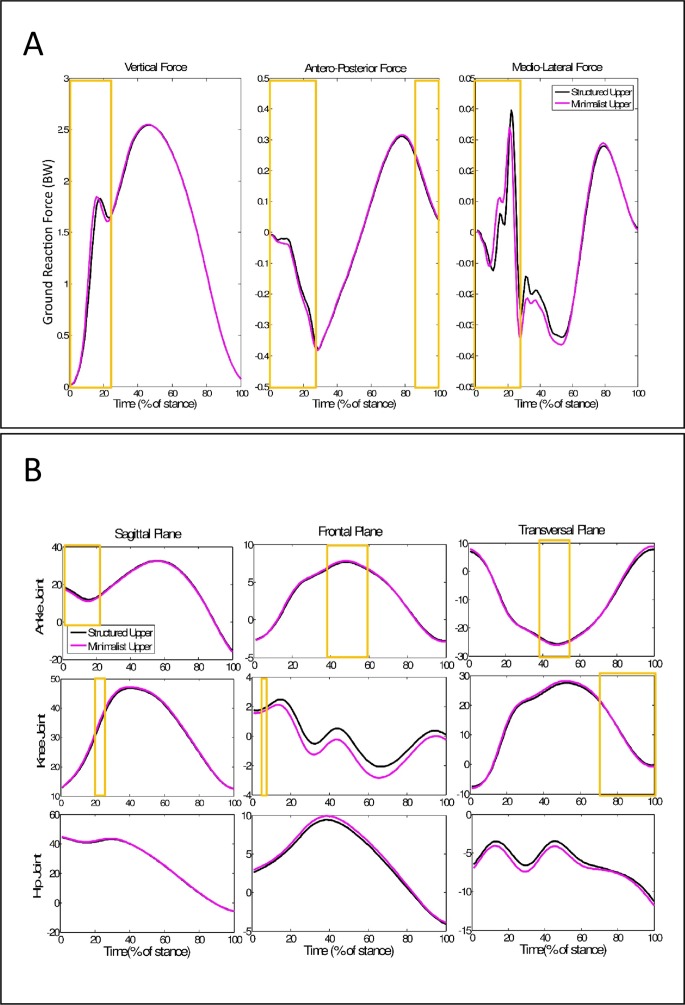
Figure 5. Ground reaction force and kinematics time-series during running with different shoe upper structures.
(A) Mean time series of ground reaction force for different shoe upper structures. (B) Mean time series of joints kinematics in all planes of motion for different shoe upper structures. Black lines represent the structured upper condition and Pink dotted lines represent the minimalist upper condition. The 200 highest IG variables are highlighted in the yellow boxes.

