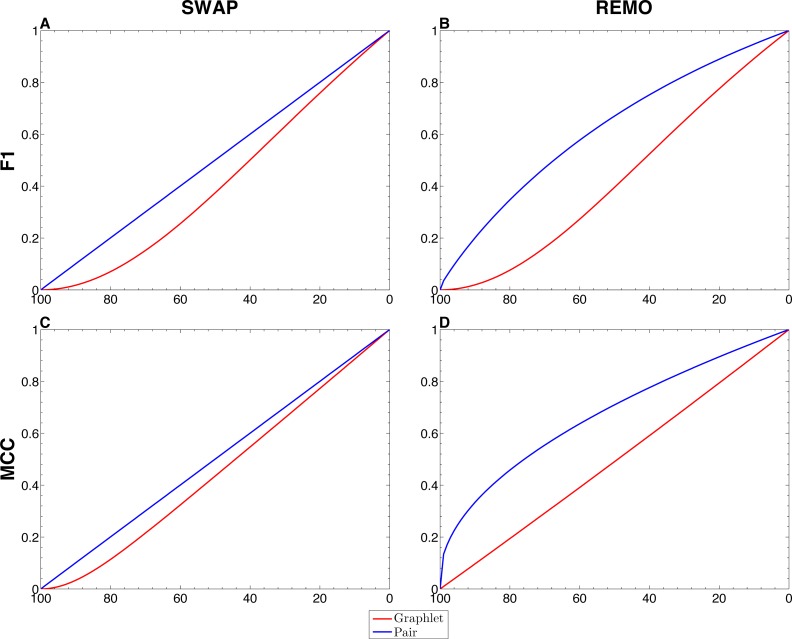
Figure 2. Comparison between single-edge and GBMs.
For each randomization procedure, average values over 1 × 10³ replicas for single-edge (solid blue line) and graphlet-based (solid red line) F1 and MCC are shown at different percentages of randomization. (A and B) Show F1 for SWAP and REMO randomizations respectively; and (C and D) show MCC for the SWAP and REMO cases respectively.

