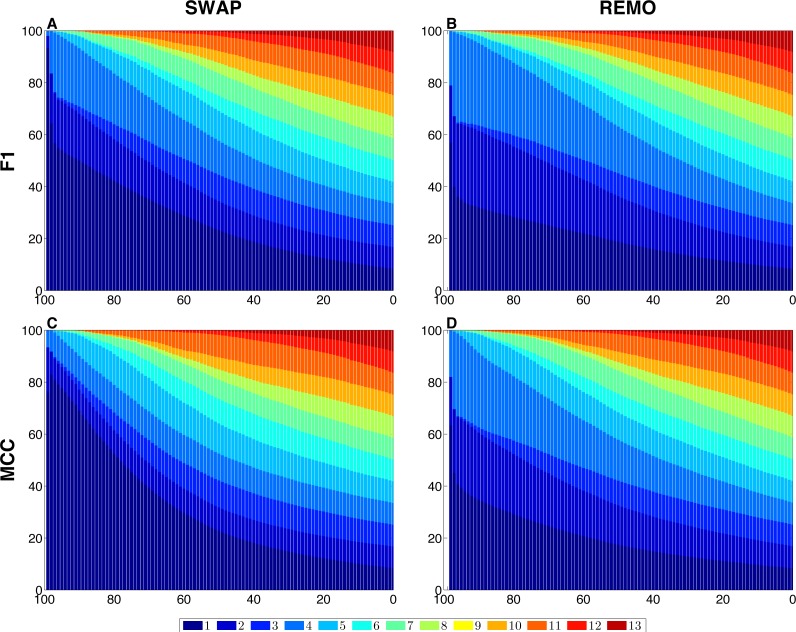
Figure 3. Contribution of each graphlet type to F1 and MCC GBMs on the two randomization procedures of the E. coli reference network.
For each randomization procedure, the plots show the contribution of each graphlet type to the averaged values of each metric over the 1 × 10³ replicas. The X-axis indicates the percentage of randomization, ranging from total randomization on the lefthand side to no variation on the right side. The Y-axis indicates the contribution of each graphlet type to the metric in the form of a percentage. (A) shows F1 for the SWAP randomization, and (B) F1 for the REMO randomizations respectively; and (C and D), MCC for the SWAP and REMO cases, respectively.

