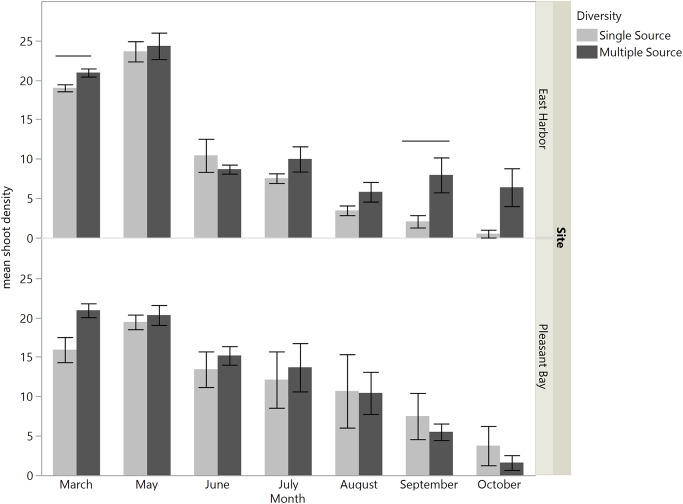
Figure 4. Mean shoot density values per plot at each site for single source and multiple source plots for the months March and May through October.
Significant differences were observed between treatments only at East Harbor (denoted by solid bar) at p < 0.05 (mean ± SE); n = 4 for all months at each site except in March at Pleasant Bay (where n = 3).

