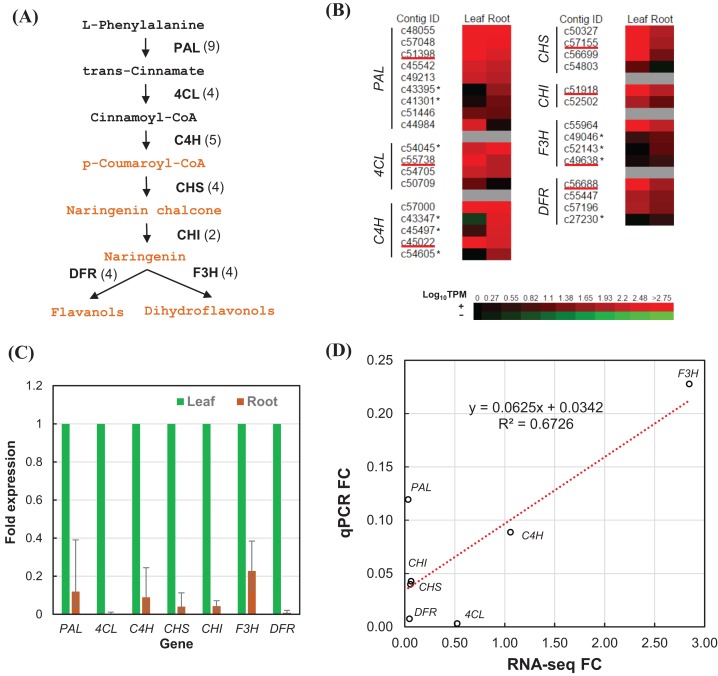
Figure 6. RT-qPCR validation of RNA-seq relative expression estimation.
(A) The integrated phenylpropanoid (black) and flavonoid (orange) biosynthesis pathway showing selected genes. Each gene is followed in parentheses by the number of contigs homologous to gene families encoding this enzyme which are expressed in the leaf and root tissues. (B) Expression heatmap of contigs expressed in the leaf and root tissues sorted in descending order of root expression values (Log10 TPM). Contigs chosen for RT-qPCR are underlined whereas contigs showing higher expression in the root are marked with an asterisk. (C) RT-qPCR analysis showing the fold of expression level in the root relative to expression level in the leaf. Error bars show the confidence intervals calculated from 1 SE of ΔΔCt. (D) Correlation plot between the RT-qPCR fold-change (FC) compared to FC calculated from TPM values of RSEM estimates. PAL, phenylalanine ammonia-lyase; 4CL, 4-coumarate—CoA ligase; C4H, trans-cinnamate-4-monooxygenase; CHS, chalcone synthase; CHI, chalcone isomerase; F3H, flavanone 3-dioxygenase; DFR, dihydroflavonol-4-reductase.

