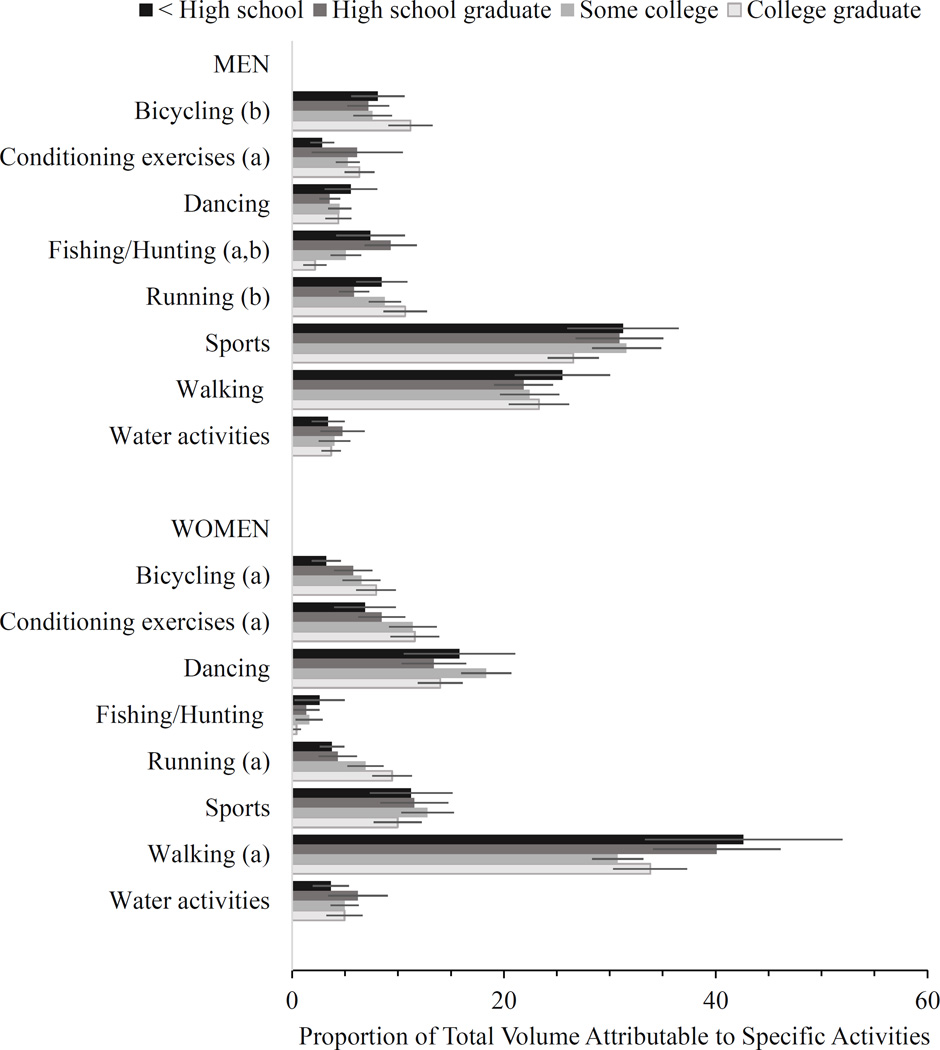
Figure 3.
Proportion of Total Volume of Leisure-Time Physical Activity Attributable to Specific Types of Activities, by Sex and Education, NHANES 1999 – 2006.
Note: Error bars represent lower and upper bounds of the 95% confidence interval; activities with total proportion < 1% (winter activities and other activities not specified) not presented.
a. Linear trend of attributable proportion by age significant (P < .05).
b. Quadratic trend of attributable proportion by age significant (P < .05).

