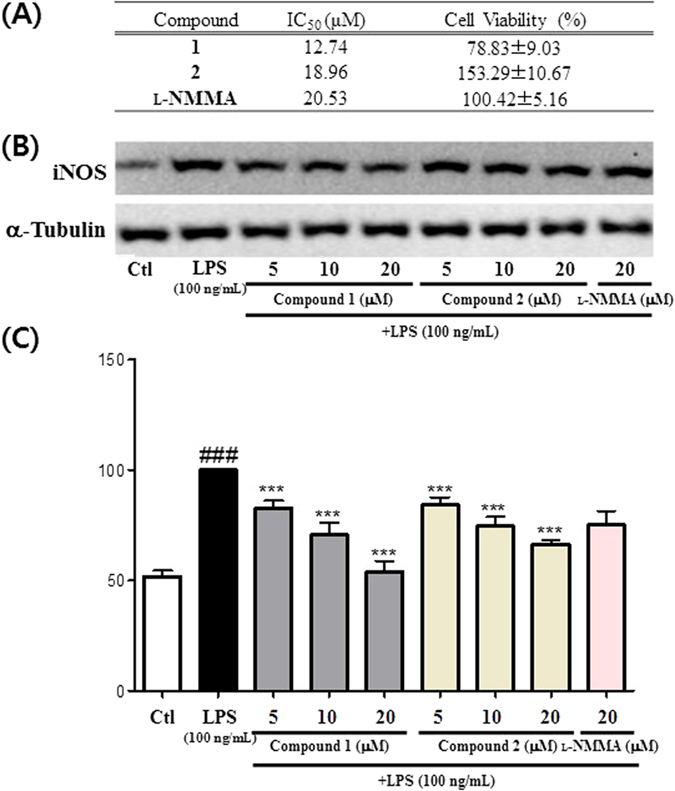
Figure 6. Effect of compounds 1 and 2 inhibiting NO production and iNOS expression in LPS (100 ng/mL)-stimulated BV2 cells.

(A) IC50 (μM) value and cell viability at 20 μM compound treatment against LPS treated group (set as 100%). (B) iNOS expression in LPS-stimulated BV2 cells. (C) Densitometric analysis of iNOS expression. All data are presented as the mean ± SEM of three independent experiments. ###p < 0.001 vs. untreated Ctl cells. *p < 0.5, **p < 0.01, ***p < 0.001 vs. LPS treated cells.
