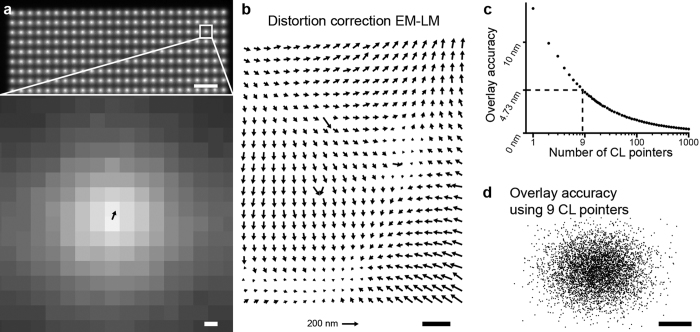
Figure 2. CL pointer array with retrieved distortion field and overlay accuracy.
(a) Upper part of a 25 × 25 CL pointer array as recorded using the optical microscope. The magnified view shows the displacement vector δ between FM and transformed EM coordinates drawn to scale. (b) By averaging displacement vectors as shown in (a) over multiple acquisitions, a distortion field between FM and EM coordinates is calculated. (c) The estimated overlay accuracy versus the number of CL pointers shows a predicted N−1/2 behavior. For this experiment, the accuracy is <5 nm for ≥9 CL pointers. (d) Distribution of overlay errors using different sets of 9 CL pointers. Scale bars are (a-top and b) 10 μm, (a-bottom) 200 nm and (d) 5 nm. The scale for the length of the distortion vectors in (b) is indicated by the arrow at the bottom indicating 200 nm distortion.

