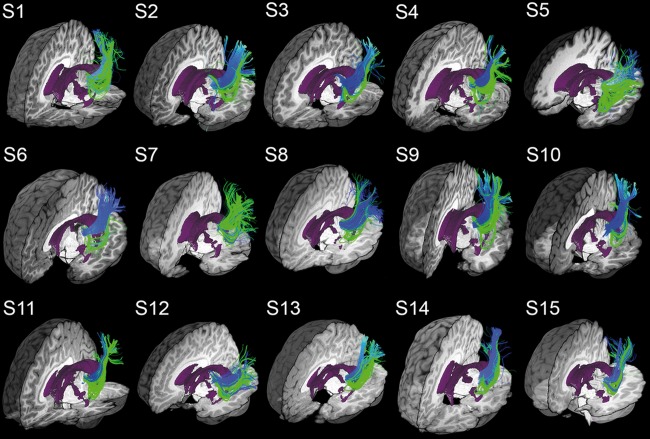
Figure 6.

MAGNET reconstruction of Meyer's loop (green) shows visual improvements in volume coverage and anterior extent as opposed to deterministic tractography using Boolean operators (blue). Overlapping green streamlines may obscure underlying blue pathways due to an increased bundle density. Visualization was done using the FiberNavigator [Chamberland et al., 2014]. Demo available online at: http://www.youtube.com/watch?v=0m3AoYcl6mA. [Color figure can be viewed at http://wileyonlinelibrary.com]
