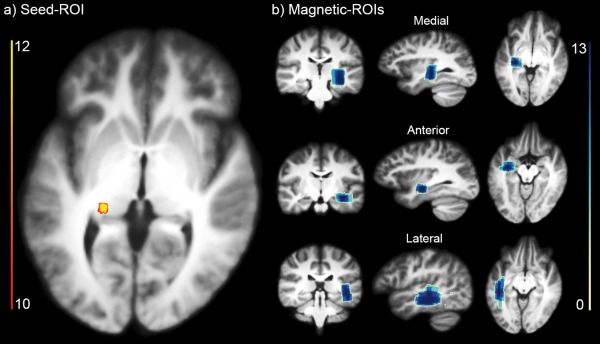
Figure 8.

Probability‐map of ROIs positioning shows coherent overlap between different subjects. (a) Seed‐ROI overlap. (b) Directional‐ROIs overlap (medial, anterior, lateral). Scale indicates the amount of subjects sharing an ROI at every voxel. [Color figure can be viewed at http://wileyonlinelibrary.com]
