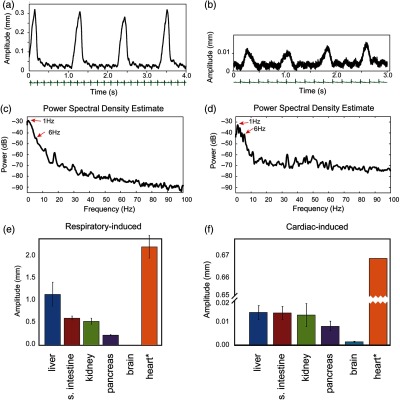
Fig. 2.

In vivo motion characterization. (a) A typical example of tissue movement as measured by the custom-made motion characterization system. Two dominant repetitive motions are observed. The one with big amplitude is due to respiration and the small one due to cardiac activity. The ECG measurement in green color confirms that the small movement is caused by the heartbeat, and it is synchronized with motion. (b) A measurement of mouse brain movement during an imaging session. (c,d) Frequency analysis of (a) and (b), respectively, indicates major peaks at and 6 Hz corresponding to respiration and cardiac motion frequency. (e, f) Peak-to-peak displacements as measured at various organs and induced by (e) respiratory and (f) cardiac activity during surgically open mouse imaging. Errors in (e) are calculated by measuring displacements over a 5-s period, and averaging three times over continuous traces acquired for 1 min. Errors in (f) are calculated by considering parts of the traces where respiratory motion is absent and averaging over multiple cardiac-induced peak-to-peak samples. * indicates that an artificial animal ventilator was employed for heart motion characterization. Here, a calculated error of 40 μm is present.
