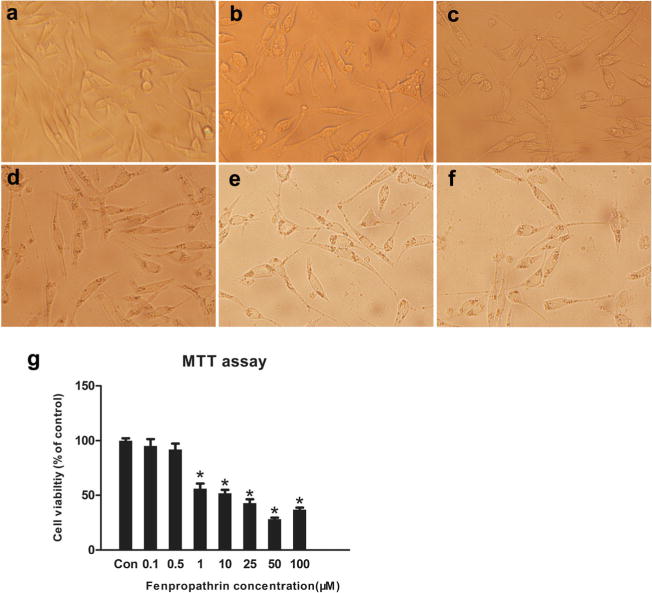
Fig. 1.

Fenpropathrin induced morphological changes and decreased viability in SH-SY5Y .a–f Morphological changes in cells after 24 h treatment with fenpropathrin in Con, Fen-1, Fen-10, Fen-25, Fen-50, and Fen-100 groups; g Dose-dependent effect of fenpropathrin treatment for 24 h on cell viability in Con, Fen-0.5, Fen-1, Fen-10, Fen-25, Fen-50, and Fen-100 groups. Results are expressed as percentage of values in untreated control culture and are calculated as mean ± standard error of three replicate values in three independent experiments. Significant changes are expressed as *P<0.05, compared to the Con group
