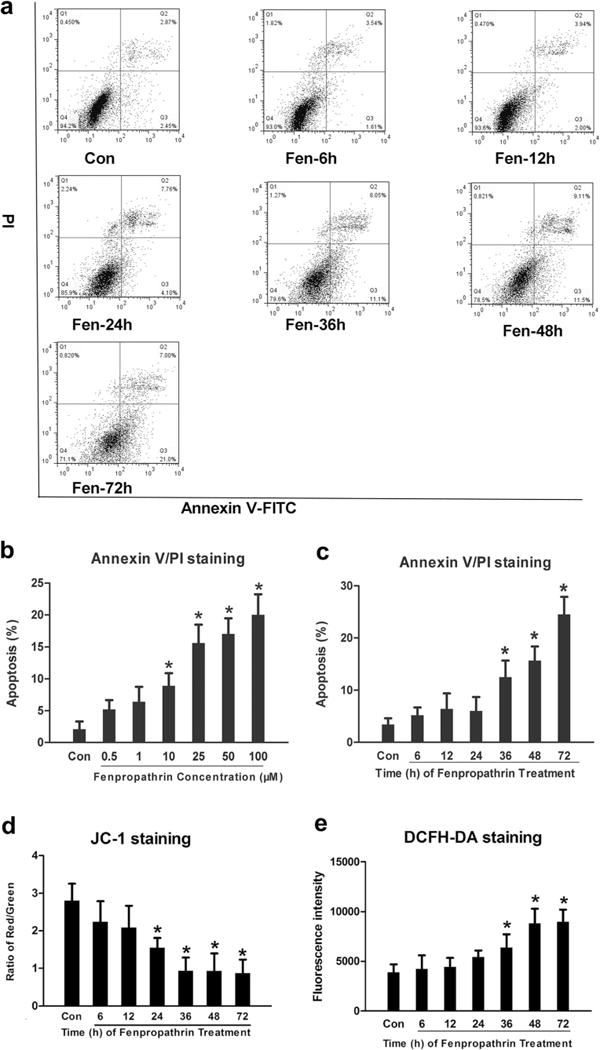
Fig. 2.

Fenpropathrin induced dose- and time-dependently apoptosis, time-dependently MMP decrease, and ROS generation in SH-SY5Y. a Scatter diagram of propidium iodide (PI)/Annexin V gating from fenpropathrin (25 μM) treatment in Con, Fen-6 h, Fen-12 h, Fen-24 h, Fen-36 h, Fen-48 h, and Fen-72 h groups (the apoptosis rates=[Annexin V(+)/PI(+) cells+Annexin V(+)/PI(−) cells]/total cells×100 %). b, c Statistical analysis of apoptosis rates in dose-dependent groups or time-dependent groups (*P<0.05, compared to the Con group). d Relative percentage of red/green immunofluorescence stained cells in Con, Fen-6 h, Fen-12 h, Fen-24 h, Fen-36 h, Fen-48 h, and Fen-72 h groups. e Fluorescence intensity of DCFH in Con, Fen-6 h, Fen-12 h, Fen-24 h, Fen-36 h, Fen-48 h, and Fen-72 h groups (*P<0.05, compared to the Con group)
