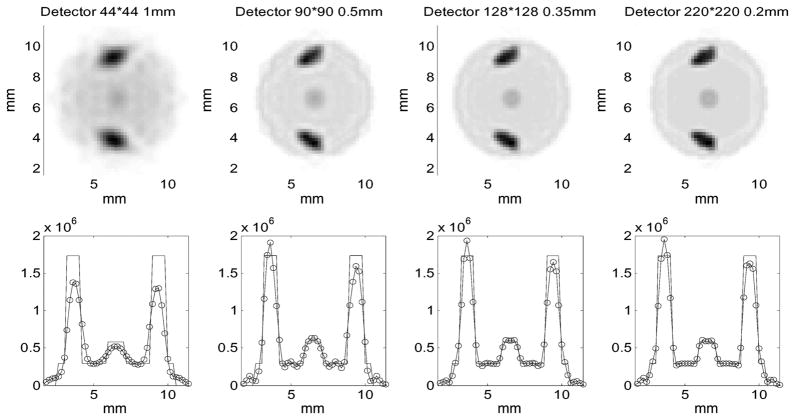
Fig. 10.
Reconstructed images of the phantom with a hot blob at the center. These figures serve as a visual confirmation of the bias-variance tradeoff curves as shown in Fig. 6. The four columns are corresponding to the operation points highlighted in Fig. 9. The pixel sizes simulated and the total number of pixels in each detector are given on the top.

