Fig. 2.

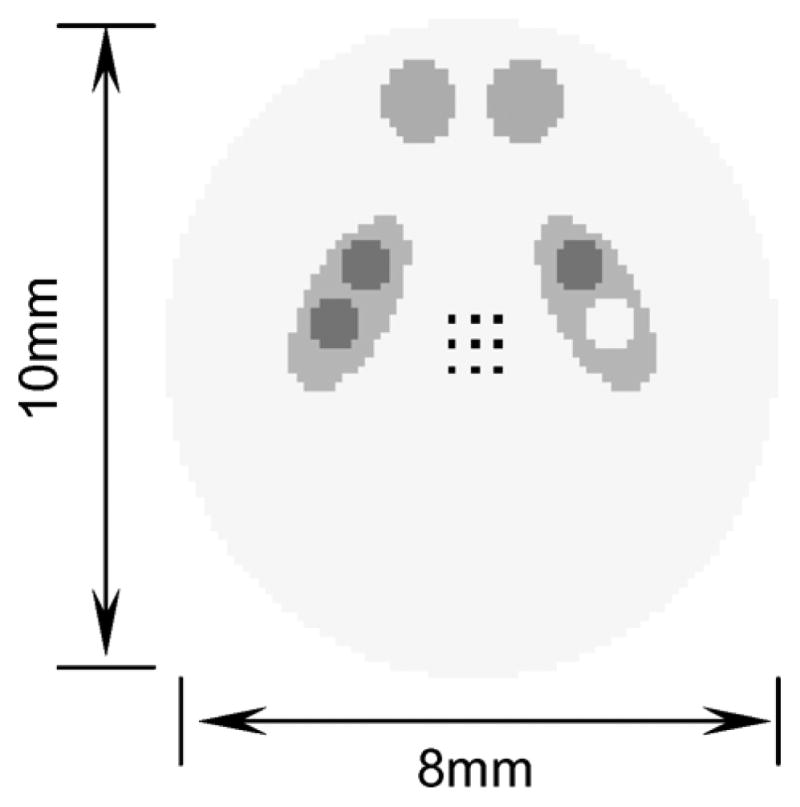
Cross sections of the resolution phantom. Nine control points were selected (as shown with black dots) for the calculation of the average resolution-variance tradeoffs.

Cross sections of the resolution phantom. Nine control points were selected (as shown with black dots) for the calculation of the average resolution-variance tradeoffs.