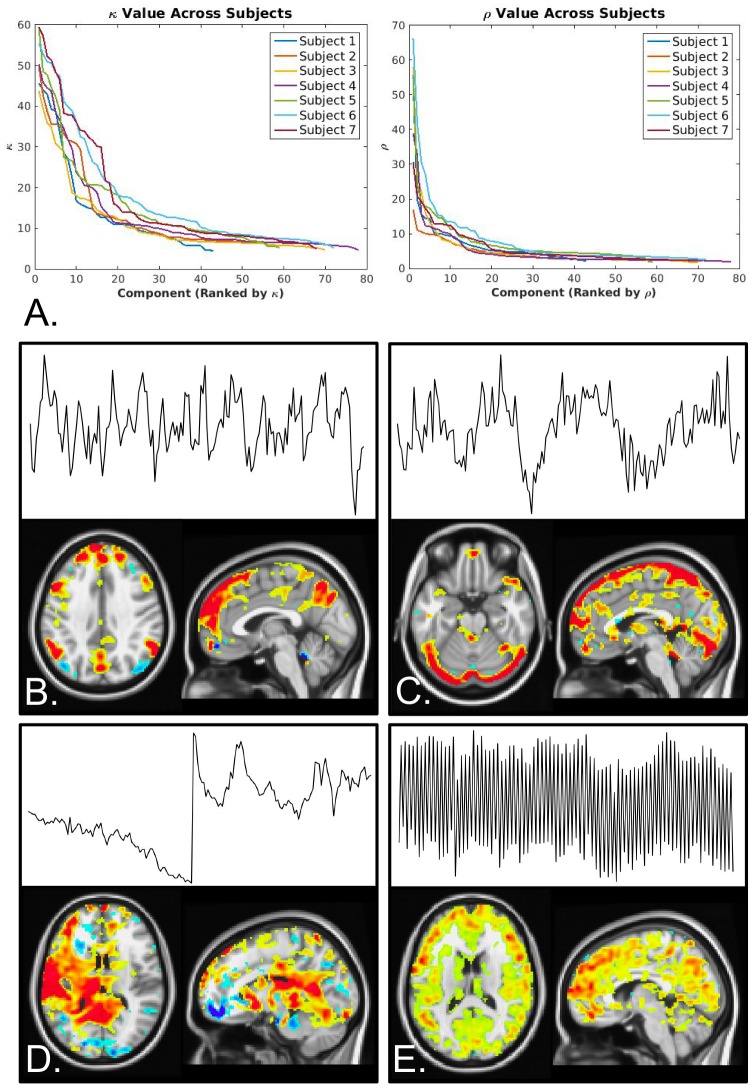
Fig 4. MEICA performance.
A. Curves of κ and ρ for all subjects. Both curves display the characteristic “L” shape expected from the ME-ICA algorithm. κ describes the goodness of fit to the TE dependence of each component and ρ described the fit to a ΔS0 model. In general, components with κ above and ρ below the elbow are kept in the denoised timeseries. B-E display example networks from one representative subject. B. An example accepted BOLD component (DMN). C. A rejected component classified as an R2* artifact. D. A rejected non-BOLD component. E. A rejected PW component.

