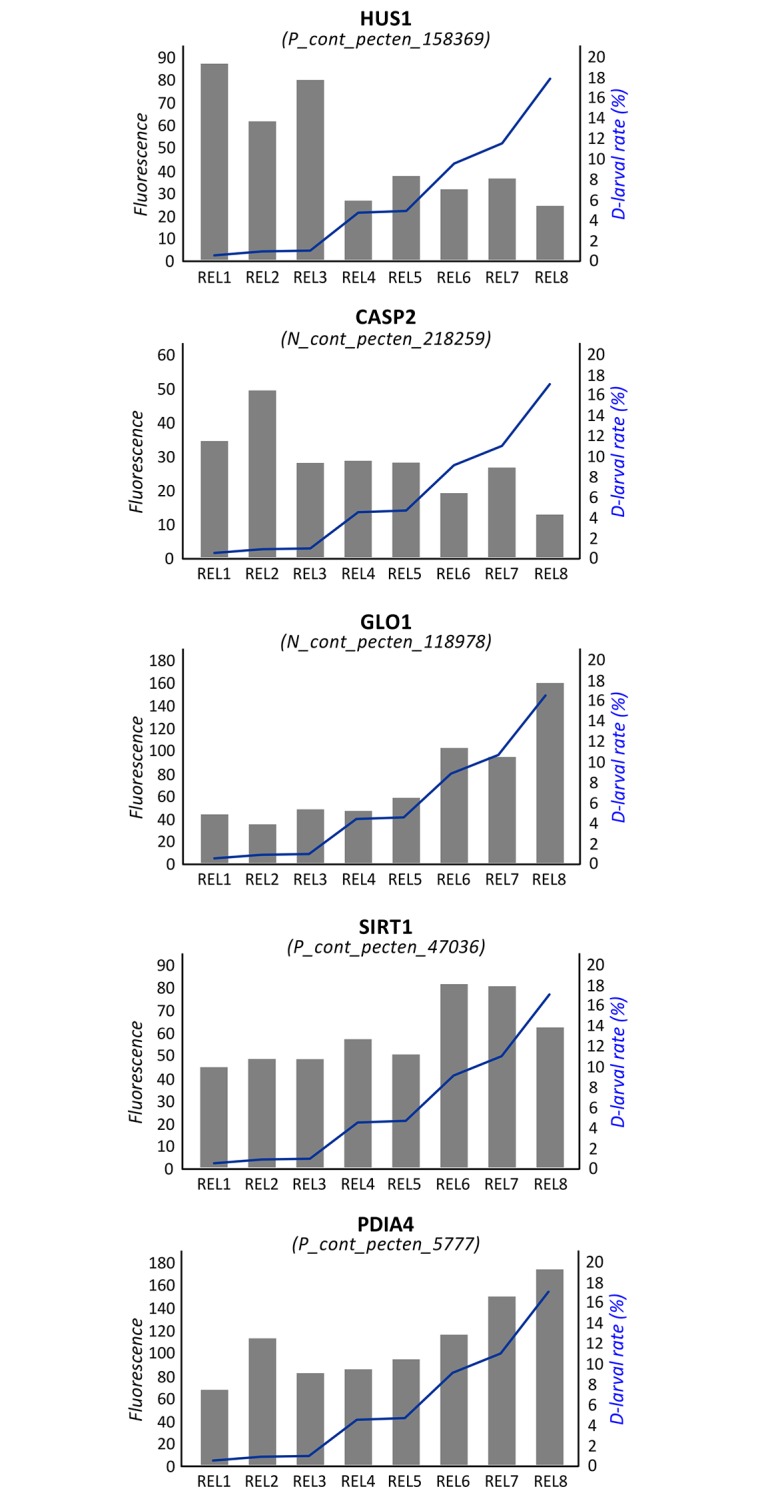
Fig 3. Correlation between gene expression and D-larval rates.

Values of fluorescence reported for probes encoding HUS1, CASP2, GLO1, SIRT1 and PDIA4. Samples are reported in the x axis. Expression level (principal y axis) is expressed in terms normalized fluorescence. The D-larval rate is reported in term of percentage (secondary y axis) and described by a blue line.
