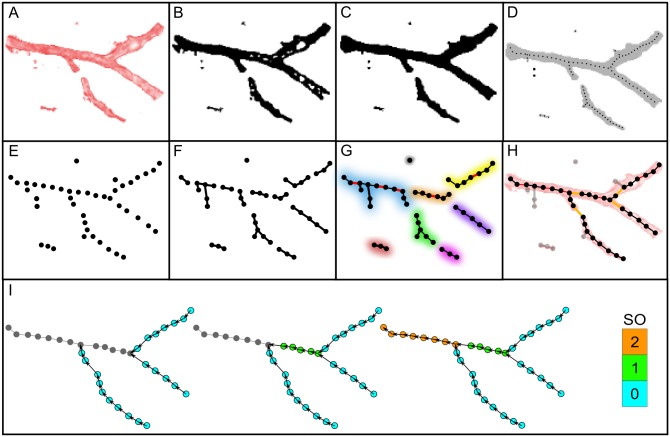
Fig 1. Schematic representation of vessel network extraction and classification algorithm.
A: 2D example of an artificial unprocessed vascular segment. Color intensity signifies the HU value of a given voxel. B: Binary image of the vessel after thresholding. Black voxels are foreground voxels, while white voxels characterize the background. C: The application of a morphological closing operator to the binary image. D: Skeletonization of the processed binary image. The skeleton is represented with a thin dotted line. E: Extracted individual centerline points as nodes of a disconnected network. F: Establishing connections between suitable nearest neighbors. G: Connecting close enough nodes with degrees 0 and 1 (red lines, colored segments characterize individual sub-networks). H: Establishing connections between unconnected sub-networks. Light gray nodes and edges signify removed components. I: An illustration of the Strahler classification scheme. The gray nodes have not yet prescribed SO values, whereas other colors of nodes correspond to the SO as given by the color-bar on the right.

