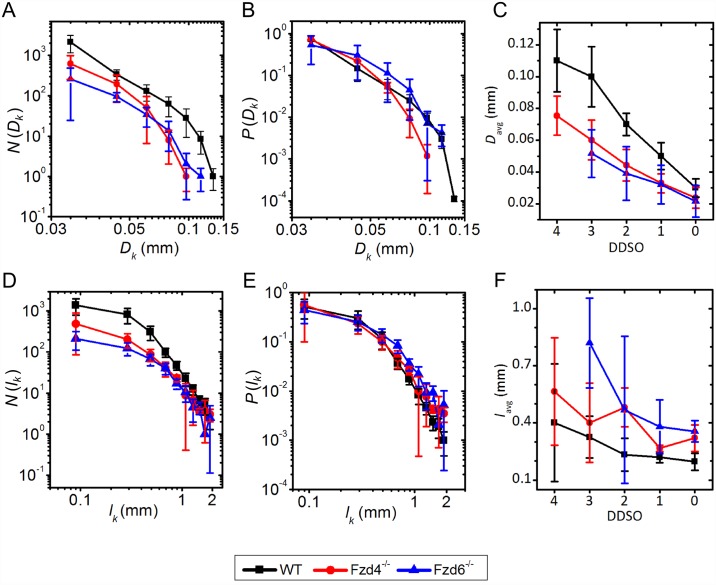
Fig 4. Diameter and length distribution.
A, B, C. Log-log plots of absolute (A) and relative (B) diameter distributions, and the average diameters in individual Strahler Orders (DDSO) (C). D, E, F. Log-log plots of absolute (D) and relative (E) vessel segment length distribution and average vessel segment lengths of individual Strahler Orders (F) for WT (black), Fzd4-/-(blue) and Fzd6-/-(red) phenotypes. Error bars stand for the SD.

