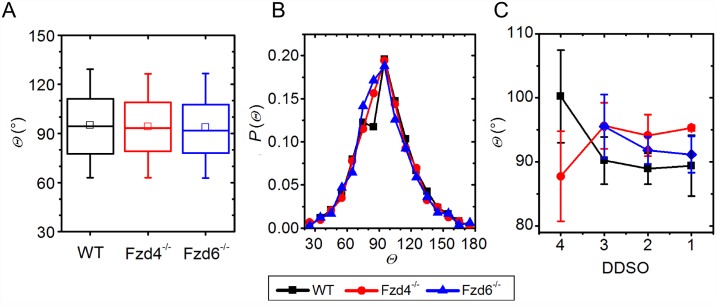
Fig 5. Bifurcation angle distribution.
A & B: Bifurcation angles (Θ) for individual groups for the whole organ (A) and their frequency distribution (B). C: Average angles per DDSO. In the box chart diagrams in A, the boxes determinate the interval within the 25th and 75th percentiles and whiskers denote the interval within the 5th and 95th percentiles, lines within the boxes indicate the medians, and the small squares stand for the average value. The error bars in panel C stand for the SD. Black: WT, blue: Fzd4-/-, red: Fzd6-/-.

