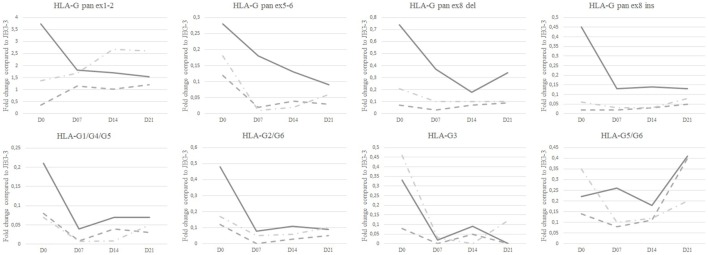
Figure 1.
HLA-G isoform transcriptional expression analyzed by Q-PCR. Median fold change as compared to JEG-3 in healthy controls (solid line), patients with mild asthma (dashed line), and patients with severe asthma (dashed and dotted line) at day 0 (D0), D7, D14, and D21. Medians with range are described in Table S3 in Supplementary Material.

