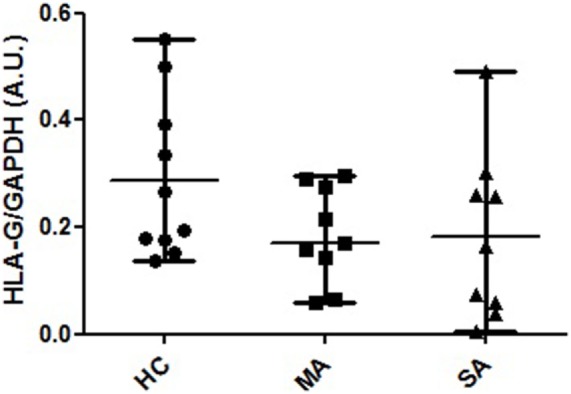
Figure 4.

HLA-G protein expression in human bronchial epithelium cell lysates from healthy controls (HC), patients with mild asthma (MA), and patients with severe asthma (SA). Semi-quantitative analysis (A.U., arbitrary units, mean and range) of Western Blot 4H84 staining normalized with GAPDH (mAb clone 9545) staining in HC [N = 10; 0.231 (0.137–0.552)], MA [N = 9; 0.186 (0.06–0.291)] and SA [N = 9; 0165 (0.004–0.492)]. The bands observed at 39 and 37 kDa may correspond to the biggest open reading frame from nucleotide 1 of HLA-G1 and HLA-G5 mRNA, respectively. Kruskal–Wallis ANOVA (HC, MA, SA) p = 0.214, non-significant; Mann–Whitney (HC vs. MA and SA) p = 0.088, non-significant.
