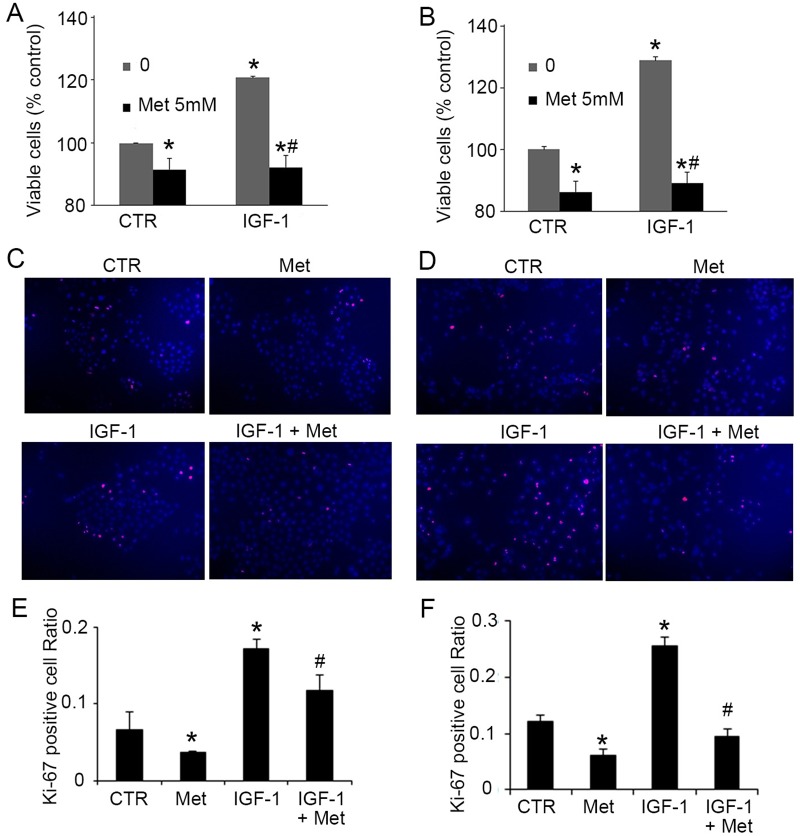
Fig 2. Metformin inhibits IGF-1-induced growth of BPH-1 and P69 cells.
A-B: Cell viability (MTS test) of BPH-1 (A) and P69 (B) 24 hours after treatment of 100 ng/mL IGF-1 with/without 5 mM metformin. C-D: Representative picture of Ki-67 staining in BPH-1 (C) and P69 (D) cells 24 hours after treatment of 100 ng/mL IGF-1 with/without 5 mM metformin. E-F: Quantification of Ki-67 staining in BPH-1 (E) and P69 (F). *, P<0.05 compared with the control group; #, P<0.05 compared with the IGF-1 group. CTR: non-treated control, Met: metformin.

