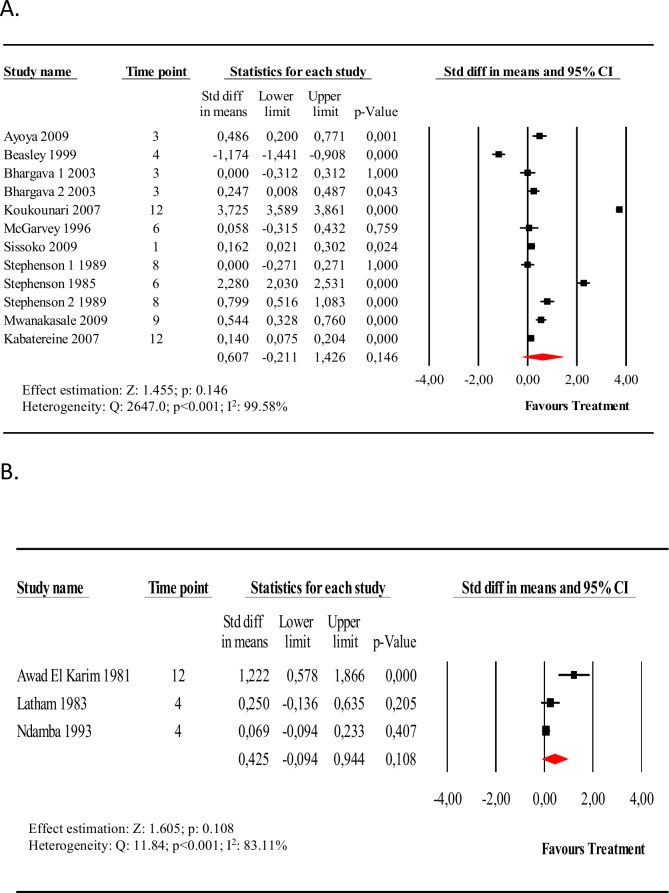
Fig 3. Forest plot of the effect of anti-schistosomal treatment on hemoglobin levels.
Panel A, Forest plot and meta-analysis for the difference in mean hemoglobin levels, pre-intervention vs. post-intervention, for school-age subjects. Panel B, Forest plot and meta-analysis for the difference in mean hemoglobin levels, pre-intervention vs. post-intervention, for adult males.

