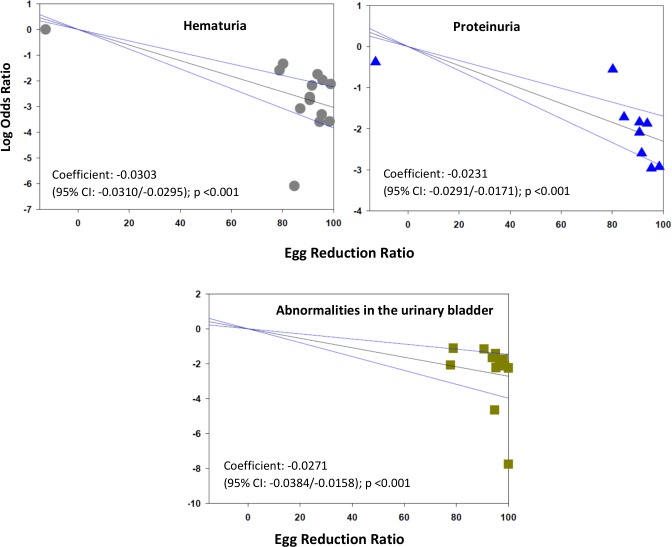
Fig 6. Log odds ratio of hematuria, proteinuria, and bladder abnormalities according to post-treatment egg reduction rate.
The panels show the log10 of the post-treatment/pre-treatment odds ratio of morbidity according to post-treatment egg reduction rate (ERR) as related to hematuria (upper left panel), n = 14, proteinuria (upper right panel), n = 9, or urinary bladder abnormalities detected on ultrasound (lower panel), n = 12.

